bam_clusters: Function to estimate the connectivity of suitable areas
Source:R/bam_clusters.R
bam_clusters.RdFunction to estimate the connectivity of suitable areas given an adjacency matrix.
Arguments
- model
A niche model in raster format or a
setAobject (seemodel2sparse).- ngbs
Numeric. Number of neighbors (see details).
- set_M
A setM object containing the adjacency matrix of the study area. The default value is set to NULL
- plot_model
Logical. Indicates whether to plot the niche model using a leaflet map, connected suitable cells shown in the same color.
Value
An object of class csd. It contains three slots.
1) connections: a data.frame with three columns where first and the second
represent (x and y) centroid coordinates of the niche model
and the third column with the cluster ID where they belong.
2) interactive_map: a leaflet map of connected suitable pixels shown in
the same color. 3) A RasterLayer of connected suitable pixels.
Details
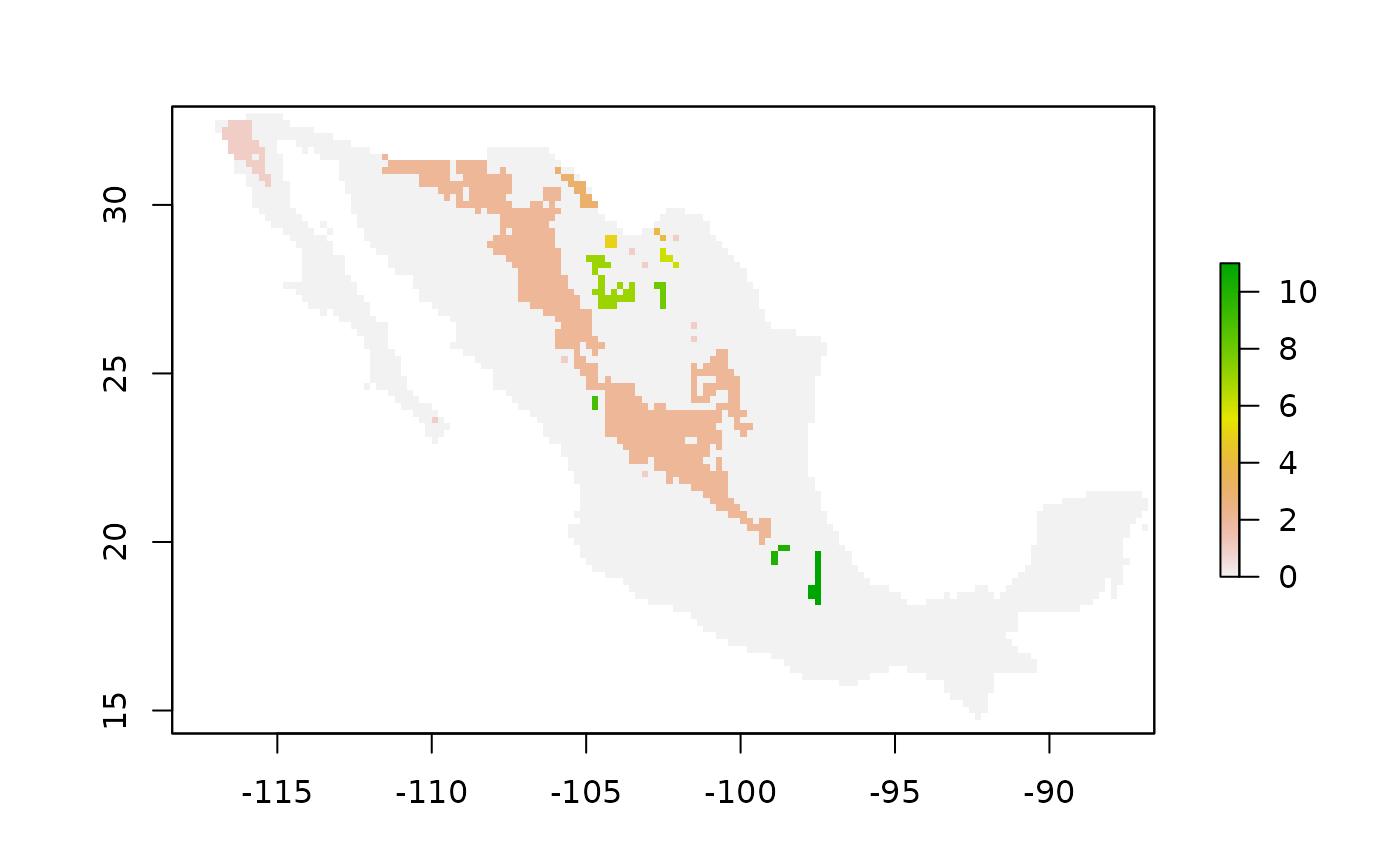
The main result of the function is the Connectivity-Suitability-Diagram (CSD). In this diagram connected suitable cells make clusters of pixels. For more details about the CSD see (Soberon and Osorio-Olvera, 2022).
References
Soberón J, Osorio-Olvera L (2023). “A dynamic theory of the area of distribution.” Journal of Biogeography6, 50, 1037-1048. doi:10.1111/jbi.14587 , https://onlinelibrary.wiley.com/doi/abs/10.1111/jbi.14587. .
Examples
set.seed(891)
model_path <- system.file("extdata/Lepus_californicus_cont.tif",
package = "bamm")
model <- raster::raster(model_path)
model <- model > 0.7
clusterin <- bamm::bam_clusters(model,ngbs=1,plot_model=TRUE)
raster::plot(clusterin@raster_map)
 # \donttest{
clusterin@interactive_map
# }
# \donttest{
clusterin@interactive_map
# }